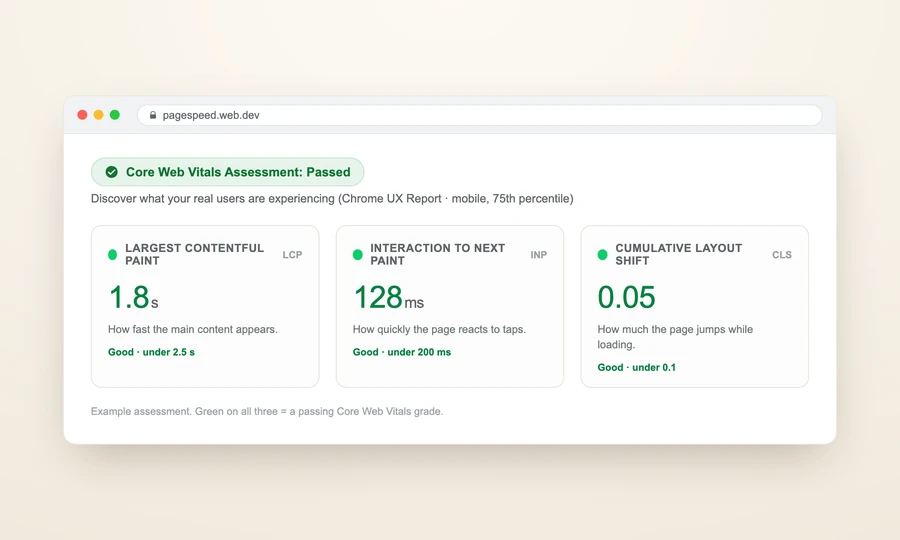
Core Web Vitals are Google's three official metrics for how your website feels to real visitors. The three are LCP, INP, and CLS — each explained in full below. LCP is how fast the main content appears. INP is how quickly the page reacts to taps. CLS is how much the page jumps around. Google measures them from actual users and feeds the scores into ranking.
You may have seen "Core Web Vitals: failed" in a report and wondered what it meant. This guide decodes it. We'll explain each metric as something you've felt as a web user. We'll give the exact target for each. Then we'll show where the numbers come from and list the fixes to hand your developer.
Why does Google measure Core Web Vitals?
Google wants to rank pages people enjoy using. So it measures three things every visitor notices: how fast the page shows up, how fast it responds, and how steady it stays.
These three are the official Core Web Vitals. Google grades them from real visitor data, not a lab simulation. They feed into ranking. They are not the whole story, though. In our own audit, performance is 10% of the SEO score. So it matters, but it does not make or break you alone.
Here is one idea to hold onto. Each metric is scored on the experience of your slower visitors, not your fastest ones. Google looks at the 75th percentile. That means three out of four visitors should get the good experience or better. We'll come back to this when we discuss the data.
The rest of this guide walks through each metric, then the data behind it, then the supporting checks, then the fixes.
What is LCP (Largest Contentful Paint)?
You click a link. The screen is blank, or half-loaded. You wait for the main thing to show up — usually a big image or headline. That wait is what LCP measures.
LCP stands for Largest Contentful Paint. It is the time until the largest visible element on screen finishes loading. Most often that is the hero image or the main heading. A fast LCP means the page feels ready quickly.
Here are the bands Google uses:
| LCP score | Grade | What it feels like |
|---|---|---|
| Under 2.5 seconds | Good | The page appears promptly |
| 2.5 to 4.0 seconds | Needs improvement | Noticeably slow |
| Over 4.0 seconds | Poor | A long, frustrating wait |
Your target is under 2.5 seconds. A few fixes usually get you there:
- Compress and modernize the hero image. Use modern formats like WebP or AVIF, which are far smaller than old JPEGs.
- Preload the hero image and set
fetchpriority="high". This is a VIP pass in the browser's download queue. It tells the browser to grab that image first. - Speed up the server. Aim to start responding in under 800 milliseconds. More on that below.
- Remove files that block the screen. Some scripts and stylesheets keep the page blank while they load.
One warning matters here. Never add loading="lazy" to your hero image. Lazy loading delays an image until a visitor scrolls near it. That is great for images down the page. But on the first thing visitors see, it directly hurts LCP. For the full breakdown, see what is LCP, Largest Contentful Paint explained.
What is INP (Interaction to Next Paint)?
You tap a button. Nothing happens. You tap again. Then, half a second later, the page finally reacts. That lag is what INP measures.
INP stands for Interaction to Next Paint. It is the delay between you doing something — a click, a tap, a keystroke — and the page visibly responding. It looks across all your interactions on the page, not just the first one. Under a fifth of a second feels instant. Longer feels sticky and broken.
INP is the newest of the three. It replaced FID (First Input Delay) as a Core Web Vital on March 12, 2024. FID is retired. If a tool or article still talks about FID as current, it is out of date.
Here are the bands:
| INP score | Grade | What it feels like |
|---|---|---|
| Under 200 milliseconds | Good | Taps feel instant |
| 200 to 500 milliseconds | Needs improvement | A slight lag |
| Over 500 milliseconds | Poor | Clearly unresponsive |
Your target is under 200 milliseconds. Most INP problems come from too much JavaScript running at once. JavaScript is the code that makes a page interactive. When it hogs the browser, taps get stuck. The fixes:
- Break up long JavaScript tasks. Any single task over 50 milliseconds can block a response. Splitting them keeps the page reactive.
- Defer non-essential scripts. Defer means load without blocking. Third-party scripts (chat widgets, trackers, ads) are common culprits.
- Remove heavy widgets you don't truly need.
- Debounce expensive handlers so they don't fire on every keystroke or scroll.
The deeper guide is what is INP, the Core Web Vital that replaced FID.
What is CLS (Cumulative Layout Shift)?
You go to tap a link. At that exact moment, an image or ad loads above it. Everything shoves down. You tap the wrong thing. That jump is what CLS measures.
CLS stands for Cumulative Layout Shift. It measures how much the page visibly moves around while it loads. A stable page scores low. A jumpy one scores high. Unlike the other two, lower is better here, and it is a ratio, not a time.
Here are the bands:
| CLS score | Grade | What it feels like |
|---|---|---|
| Under 0.1 | Good | The layout holds steady |
| 0.1 to 0.25 | Needs improvement | Some visible jumping |
| Over 0.25 | Poor | The page lurches around |
Your target is under 0.1. The most common cause is images without set width and height. Without dimensions, the browser can't reserve space, so content jumps when the image arrives. The fixes:
- Set explicit width and height on every image and video. This reserves the space up front.
- Give ads and embeds a fixed-size box so they don't push content when they load.
- Use
font-display: swapwith a fallback font close in size, so text doesn't reflow when the web font loads. - Never insert banners above existing content. Pushing the page down mid-read is a classic offender.
See what is CLS, why your page jumps around and how to stop it for the full list.
Where do the Core Web Vitals numbers come from?
This is the part that builds trust in the scores. Your Core Web Vitals come from real visitors, not a guess.
There are two kinds of speed data, and the difference matters:
- Field data is from real people who visited your site. Google collects it through the Chrome User Experience Report (CrUX) — its own data from actual Chrome users, not a simulation. This is what counts for ranking.
- Lab data is a single simulated load in a controlled setting. It is useful for debugging, but it is one test, not your real audience.
Our audit uses field data. It calls Google's PageSpeed Insights API (PSI), which is the official way to access these scores. Then it pulls the 75th-percentile real-user numbers from CrUX. Remember the 75th percentile: it reflects the experience of your slower visitors, not your best ones. Mobile values come first, with desktop kept as a reference.
We are careful with edge cases. If a page has no field data, the audit falls back to data for your whole site. If there is no data at all, it reports that plainly rather than guessing. We never invent a number you didn't earn.
One small technical detail shows the rigor. CrUX returns CLS as a whole number scaled up by 100. So a raw value of 8 means a real CLS of 0.08. Getting that division right is the difference between a passing and a failing grade.
Alongside the field data, we run HTML "flag" checks. These spot likely problems in your page code — a giant hero image, scripts that block rendering — before they show up in real-user data. Think of it like spotting fire hazards without waiting for a fire. To see how all of this rolls into one score, read how an AI-visibility audit works.
What about TTFB, page weight, and render-blocking files?
The three Core Web Vitals get the spotlight. But a few supporting metrics quietly drive them. Fixing these often fixes LCP and INP as a side effect.
TTFB (Time To First Byte)
TTFB is how long your server takes to start answering a request. It is not a Core Web Vital, but it matters because a slow server delays everything downstream, including LCP. We flag it whenever it passes 800 milliseconds. The ideal is under 200 milliseconds.
The usual fixes are caching, a CDN, and a better database or hosting setup. A CDN is a content delivery network that serves files from close to each visitor. The deep dive is what is TTFB, server response time explained.
Page weight
Page weight is the total size of everything a page downloads. Think of it as weighing the page's luggage. Heavier pages load slower, especially on mobile data.
Keep total page weight under 2MB, and under 1MB for your most important pages. A surprising share of that weight is waste. Unminified and unused CSS and JavaScript can be more than half the bytes on many sites. More on this in page weight, how heavy is your web page.
Render-blocking resources
Some files stop the page from showing anything until they finish. Scripts without a defer or async tag, and stylesheets loaded in the head, keep the screen blank while the browser waits. The fix is to defer or async those scripts, and to inline only the critical styles. See eliminate render-blocking resources, the warning explained.
Quick infrastructure wins
A few server settings give large gains for little effort:
| Setting | What it does | Typical gain |
|---|---|---|
| Gzip or Brotli compression | Shrinks text files before sending them | A 60 to 80% size cut on text |
| Long cache lifetimes | Lets browsers reuse static files | Repeat visits load far faster |
| A CDN | Serves files from a server near each visitor | Lower latency worldwide |
These pair well with the metric fixes above. For the bigger picture, see website speed for SEO and AI search and mobile usability for SEO.
Why does AI search care about your page speed?
Speed isn't just a Google ranking input anymore. It now affects whether AI assistants quote you at all.
Slow pages get crawled and cited less by both search engines and AI tools. AI crawlers spend limited time on each site. A slow response wastes that time, so they may move on before reading your content.
Microsoft's Bing Copilot is explicit about it. Its scoring gives a page 10 points if it loads in under 2 seconds, 5 points under 4 seconds, and 0 over 4 seconds. In short, Copilot avoids citing slow pages. So your speed work pays off twice: once in search rankings, and again in AI visibility.
What should you tell your developer first?
You don't need to do this work yourself. You need to know what to ask for, and in what order. Here is a triage table, sorted from easiest to hardest.
| Effort | What to change | Helps |
|---|---|---|
| One-line config | Turn on gzip or Brotli compression, set long cache lifetimes, add a CDN | TTFB, page weight, overall speed |
| Template tweaks | Add width and height to images, defer or async scripts, set fetchpriority="high" on the hero, use font-display: swap |
LCP, INP, CLS |
| Content workflow | Compress images and switch to WebP or AVIF | LCP, page weight |
| Architecture | Speed up server response, keep JavaScript bundles small, split code | TTFB, LCP, INP |
A note on that last row. JavaScript bundles draw a warning above 200KB compressed, and a critical flag above 500KB. Smaller bundles mean less code to download and run, which helps both LCP and INP.
Start at the top of the table. The config changes are cheap and fast. The template tweaks fix most Core Web Vitals failures. Only move to architecture if the simpler steps don't get you to the targets.
How our audit checks your Core Web Vitals
Our visibility audit pulls your real-visitor Core Web Vitals from Google's own field data. If that data doesn't exist for your page, we say so instead of guessing. Then we flag the specific images and scripts causing each failure, so your developer knows exactly what to fix.
Performance is 10% of the SEO score in the audit. It blends two views. One specialist reads the real CrUX field data through the PageSpeed Insights API. A second checks how the page actually renders in a real browser. The same metrics are also re-scored inside the Technical GEO category, because, as we saw, AI tools care about speed too.
Frequently asked questions
What are the three Core Web Vitals? They are LCP, INP, and CLS. LCP (Largest Contentful Paint) is how fast the main content loads. INP (Interaction to Next Paint) is how fast the page reacts to taps. CLS (Cumulative Layout Shift) is how much the page jumps around. Google measures all three from real visitors.
What are good Core Web Vitals scores? Good means LCP under 2.5 seconds, INP under 200 milliseconds, and CLS under 0.1. These are measured at the 75th percentile of real users, which reflects your slower visitors rather than your fastest ones.
Did INP replace FID? Yes. INP replaced FID (First Input Delay) as a Core Web Vital on March 12, 2024. FID is retired. Any tool still reporting FID as a current Core Web Vital is out of date.
Are Core Web Vitals a major ranking factor? They feed into ranking, but they are one input among many. In our audit, performance counts for 10% of the SEO score. Good content and a clean technical setup still matter more.
How do I check my Core Web Vitals? Run your page through Google PageSpeed Insights, which uses the same real-user field data Google ranks on. Our visibility audit pulls the same data and points to the exact files causing any failure.
What to do first
Fix the cheap things, then the targeted ones. Turn on compression, set long cache lifetimes, and add a CDN. Then have your developer set image dimensions, defer non-essential scripts, and prioritize the hero image. Those steps clear most Core Web Vitals failures.
After that, measure again with real field data. If LCP, INP, or CLS still miss their targets, move to the deeper fixes: a faster server and smaller JavaScript bundles.
Want to know where you stand right now? Run a free visibility audit. It reads your real-visitor Core Web Vitals from Google's own data. Then it flags the exact images and scripts to fix first.